https://leetcode.com/problems/house-robber/tabs/description/
一个比较明显的动态规划的题,虽然也有更好的解法,但是DP是比较容易想到,而且效率还比较高的那种。
比较轻松地做出来:
|
|
Coder love Design
https://leetcode.com/problems/house-robber/tabs/description/
一个比较明显的动态规划的题,虽然也有更好的解法,但是DP是比较容易想到,而且效率还比较高的那种。
比较轻松地做出来:
|
|
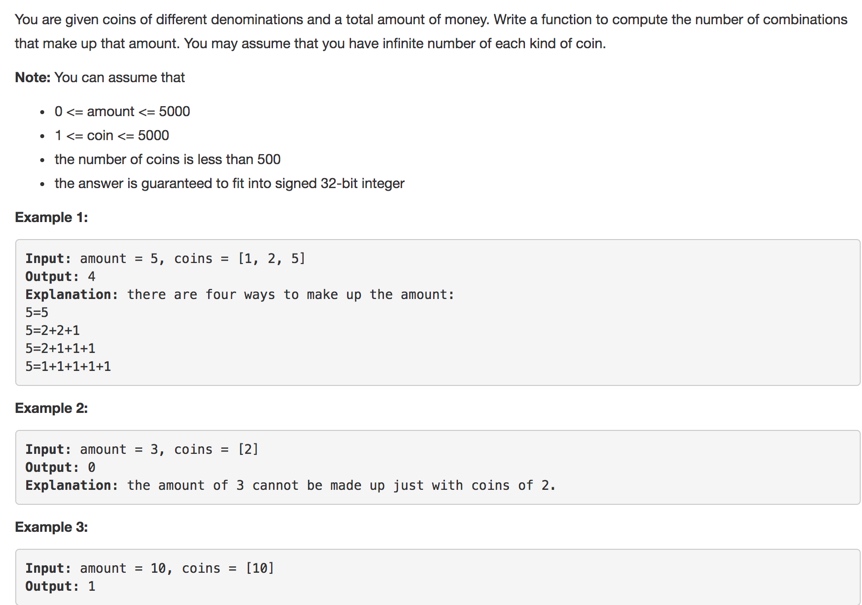
https://leetcode.com/problems/coin-change-2/tabs/description
本来超时的代码:
|
|
暴力遍历的方式,轻松就超时了。
关键思想: DP
DP是容易想到的,但是本来自己想的DP老是纠结在如何通过n-1的得到n的,但实际上这的确有点难操作。
更好的想法是,如果有一个k面值的coin,那么,n处的可能数就多了n-k个
另外,还要搞清楚的一点是,dp[0] == 1,这是dp的初始条件!
AC的解法,3ms
|
|
https://leetcode.com/problems/add-binary/tabs/description
比较简单与无聊的一道题,但是自己并没有顺利地做出来。
总没有想到一个优雅的方式去解决问题。
抄了个答案:
|
|
这个答案还是有一些要学习的地方。
-'0'这样的操作c % 2等这种用结果代替条件判断的c+=...用来搞进位的This article is to describe the project of Design Thinking course in ZJU.
This article is under updating…
Provide personalized events information around campus for students according to events contents, user’s information, etc.
But it’s hard to get real life dataset for time or some other reasons.
So…
Use a similar existing dataset from internet.
From dataset of one of Kaggle Competition.
https://www.kaggle.com/c/event-recommendation-engine-challenge/data
This is the original description of all dataset from Kaggle:
There are six files in all: train.csv, test.csv, users.csv, user_friends.csv, events.csv, and event_attendees.csv.
train.csv has six columns: user, event, invited, timestamp, interested, and not_interested. Test.csv contains the same columns as train.csv, except for interested and not_interested. Each row corresponds to an event that was shown to a user in our application. event is an id identifying an event in a our system. user is an id representing a user in our system. invited is a binary variable indicated whether the user has been invited to the event. timestamp is a ISO-8601 UTC time string representing the approximate time (+/- 2 hours) when the user saw the event in our application. interested is a binary variable indicating whether a user clicked on the “Interested” button for this event; it is 1 if the user clicked Interested and 0 if the user did not click the button. Similarly, not_interested is a binary variable indicating whether a user clicked on the “Not Interested” button for this event; it is 1 if the user clicked the button and 0 if not. It is possible that the user saw an event and clicked neither Interested nor Not Interested, and hence there are rows that contain 0,0 as values for interested,not_interested.
users.csv contains demographic data about our some of our users (including all of the users appearing in the train and test files), and it has the following columns: user_id, locale, birthyear, gender, joinedAt, location, and timezone. user_id is the id of the user in our system. locale is a string representing the user’s locale, which should be of the form language_territory. birthyear is a 4-digit integer representing the year when the user was born. gender is either male or female, depending on the user’s gender. joinedAt is an ISO-8601 UTC time string representing when the user first used our application. location is a string representing the user’s location (if known). timezone is a signed integer representing the user’s UTC offset (in minutes).
user_friends.csv contains social data about this user, and contains two columns: user and friends. user is the user’s id in our system, and friends is a space-delimited list of the user’s friends’ ids.
events.csv contains data about events in our system, and has 110 columns. The first nine columns are event_id, user_id, start_time, city, state, zip, country, lat, and lng. event_id is the id of the event, and user_id is the id of the user who created the event. city, state, zip, and country represent more details about the location of the venue (if known). lat and lng are floats representing the latitude and longitude coordinates of the venue, rounded to three decimal places. start_time is the ISO-8601 UTC time string representing when the event is scheduled to begin. The last 101 columns require a bit more explanation; first, we determined the 100 most common word stems (obtained via Porter Stemming) occuring in the name or description of a large random subset of our events. The last 101 columns are count_1, count_2, …, count_100, count_other, where count_N is an integer representing the number of times the Nth most common word stem appears in the name or description of this event. count_other is a count of the rest of the words whose stem wasn’t one of the 100 most common stems.
event_attendees.csv contains information about which users attended various events, and has the following columns: event_id, yes, maybe, invited, and no. event_id identifies the event. yes, maybe, invited, and no are space-delimited lists of user id’s representing users who indicated that they were going, maybe going, invited to, or not going to the event.
But we’ll only use part of them:
The code is show as jupyter notebook. And it will update consecutively(Below is updating info).
events.csv and take a general look of it.matplotlib to visualize it.用了两天的一些空闲时间,看完并自己跟着敲完了上边的代码自己亲自试了试。整体地走了一个用机器学习解决问题的流程,总得来说也是有一个较为清楚的认识吧,现就一些想法与笔记记录下来。
按照样例中的做法,结合自己的看法,重要的几步有:获取数据,分析数据,处理数据(对null值的处理,删除无关紧要的数据,从已有的数据中通过组合与计算等获取新的有意义的特征数据),选用模型进行学习和预测,得到结果。
主要应用pandas进行操作,其中一个很关键的一点是其中的DataFrame类型的对象,是操作数据的载体,其拥有强大的一些函数,大大方便了对数据的感知,需要之后的进一步了解其特性。
分析数据大致分为三类,一个是用一些自带的函数作大致的信息查看;第二是提取一些feature的组合来看;三是用matplotlib或seaborn等可视化工具来可视化地查看一些属性。
用到的一些常用的函数有:
|
|
用一些组合与排序的方式达到目的,如:
|
|
| Sex | Survived | |
|---|---|---|
| 0 | female | 0.742038 |
| 1 | male | 0.188908 |
这一方面,matplotlib及seaborn的函数众多,自己还需要进一步的了解,需要做到自如地处理数据,在不同的层面上比较。
drop()删除df中的无用数据:
|
|
进行计算或者组合等:
|
|
应用map将一些类型的数据,转化成数字型的,如:
|
|
因为NaN,null等值会影响学习及预测,所以进行处理,有多种用其它数据替代的方式,也有好多trick,但是相对来说比较简单。
如下,是采用有效值的平均进行替换:
|
|
先建立区间:
|
|
再将原来的数值替换为区间代号:
|
|
fit直接从sklearn中选择所需的模型,然后fit测试数据的X和Y:
|
|
predict
|
|
score
|
|
作为机器学习,或者Kaggle的入门例子,这个例子看来来还是很明确的,也有几点记在了心中。
然而,竞赛毕竟是竞赛,有着明确的dataset和明确的目的性,而且很专一地可以用机器学习去解决。而在现实生活中,有两个问题摆在机器学习的要前,一个是没有条理的数据集,二是不是那么明了的一个题目,更加的杂。这给用机器学习解决实际问题增添了一些困难。
不过,练习这些毕竟也是好的!